Creating a New Dashboard
- Click Dashboards from the left menu.
- Click Create New Dashboard.
- In the top menu, click
 to select an image to use for the dashboard thumbnail (optional).
 - Type a name for the dashboard. If no name is entered, a default name of “Dashboard <today’s date>” is used.
- Select the default time frame to use for the data displayed in the dashboard: the past day, past week, or past month.
- Select the default units to use for data displayed in the dashboard: US units or SI units. This can be different than the default units selected in User Settings and displayed in other HOBOlink pages.
-
Select the time zone to use for the data displayed in the dashboard.
- Add up to 20 widgets to the dashboard. To add a widget, you can either:
- Click the
 next to the station name and click one of the preassigned sensor widgets from the list to add it to the dashboard or
- Click a blank widget from the top menu to add it to the dashboard. Click
 in the upper right corner of the widget to select a channel for the widget and any other settings (see Changing Widget Properties for more details). If you create a calculated channel or add a new sensor, there is a delay before it is available to be selected in widgets while data is first being collected and transferred to HOBOlink. For details on adding calculated channels in Dashboards, see Working with Calculated Channels in Dashboards.
- Click the
- Click
 to adjust the position of the widget on the dashboard, which is set up in columns and rows. Drag the widget to a new location on the dashboard and it will snap to the grid (automatically placing it in the nearest column or row).
 - Click Save. Your new dashboard is displayed in view mode instead of edit mode.
Important: If you click
 before saving a new dashboard, you will lose any changes to the dashboard and have to rebuild the dashboard.
- Click
 for a preview of how the dashboard would look if you choose to share it.
 - Click
 and select Sharing to create a public URL linking to the dashboard that you can give to others (see Sharing a Dashboard for more details).
 - Click and select Edit Dashboard if you need to make changes (see Editing a Dashboard for more details).
- You can hover over some of the widgets to get more information (e.g. hover over a line chart to see data points).
- Change the time frame at the top of the dashboard to switch between past day, past week, or past month view. Widgets are automatically refreshed based on the time frame you select.
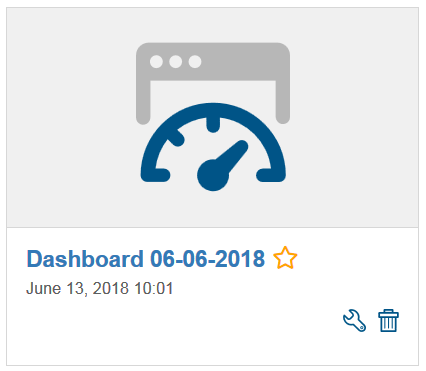
- Click to return to a list of all dashboards. The new dashboard is added to the Your Dashboards page and appears like this in tile view:
- Click
Or like this in list view:
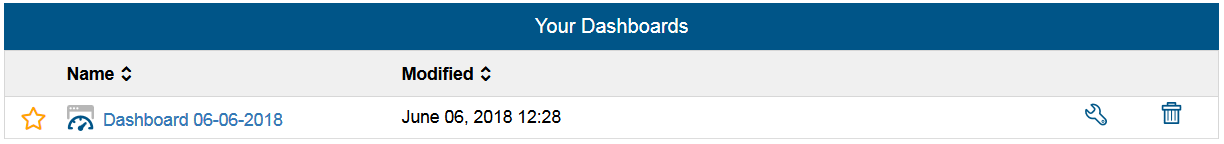
Note that in these examples the default image and name were used for the dashboard.